 Games
About this game
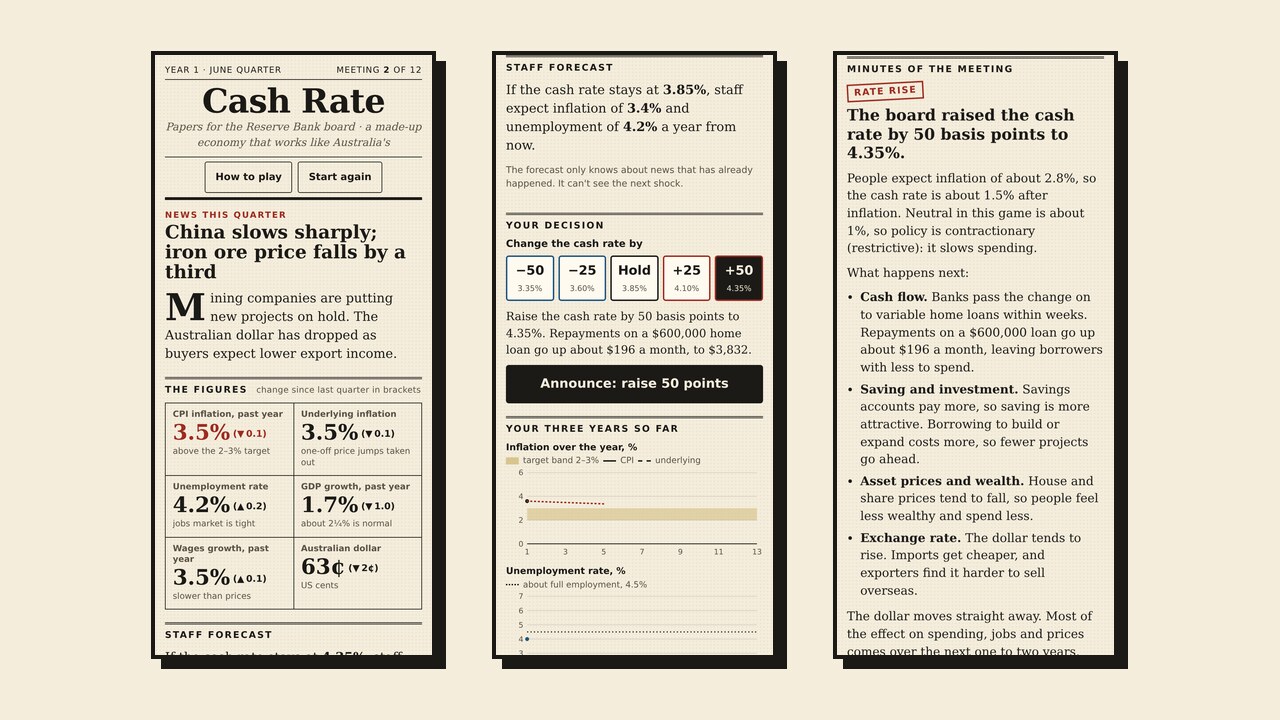
The student sits on the Reserve Bank of Australia's Monetary Policy Board. Each quarter the page looks like a newspaper: a headline, a short story and six figures. These are CPI inflation, underlying inflation, unemployment, GDP growth, wages growth and the Australian dollar. Charts show the three years so far. A staff forecast says where inflation and unemployment will be in a year if the rate stays where it is.
The student picks a change from −50 to +50 basis points, or holds, and sees what it does to the repayments on a $600,000 home loan. After they announce it, the minutes say whether policy is now contractionary, neutral or expansionary, and how the change reaches spending through cash flow, saving and investment, asset prices and the exchange rate.
Most of a change's effect arrives one to two years later, as the RBA describes. News arrives along the way. Some of it is a demand shock, such as China slowing or a spending boom, where cutting or raising helps both goals. Some is a supply shock, such as an oil price jump or floods, where inflation rises while jobs are lost and the board has to choose. Every game has at least one of each.
At the end the student gets a score out of 100 and charts of the three years. The game replays their three years without their first rate change and shows how much difference it made after a quarter, a year and two years. It also explains each shock and what they did about it. Same events again replays the same news, so students can try a different plan.
The economy is made up and much simpler than the real one. The real board meets eight times a year; in the game it meets once a quarter.
Students will
- Explain how a change in the cash rate reaches home loans, spending, the dollar, jobs and prices.
- Explain why the board acts on forecasts, using the lag between a decision and its effect.
- Tell a demand shock from a supply shock, and explain the trade-off a supply shock creates.
- Use inflation, unemployment and growth figures to justify a decision.
Curriculum links
Checked against the documents below in November 2026. It covers parts of each, not whole units.
- Year 10, Australian Curriculum v9 Economics and Business. AC9HE10K01 (how and why economic indicators influence economic decision-making), AC9HE10K02 (ways government intervenes in the economy to improve economic performance and living standards) and AC9HE10S03 (interpreting data and cause and effect). Year 10 doesn't name monetary policy, so for Year 10 the game is an example of an economic decision made from indicators. The RBA is independent of the government. NSW, Victoria and WA publish their own versions of the Years 7 to 10 curriculum, so check yours.
- Queensland, QCAA Economics 2025 (General). Unit 4, Contemporary macroeconomics: the RBA's role and charter, inflation targeting, basis points, and the transmission mechanism and its channels.
- Victoria, VCE Economics Study Design 2023–2027. Unit 4, Area of Study 1: the cash rate target, the four channels of the transmission mechanism (savings and investment, cash flow, exchange rate, asset prices and wealth), and expansionary, contractionary and neutral stances.
- Western Australia, Economics ATAR Year 12. Unit 4, Macroeconomic theory and economic policy: the cash rate, the RBA's objectives, when the RBA changes its stance, and the transmission mechanism.
- NSW, Economics Stage 6 (2009), HSC course. The monetary policy part of Economic Policies and Management. The new Economics 11–12 Syllabus (2025) starts with Year 11 in 2027 and Year 12 from Term 4 2027. Its Year 12 course includes Economic management of the Australian economy.
- SA (SACE) and Tasmania (TASC) also teach senior Economics. Check the current subject outline before using it there.
The game doesn't cover unconventional tools such as bond buying, AD/AS or AE diagrams, or real RBA data. Senior classes can add those in the discussion.
Using it in class
- Before (5 minutes). Ask what happens to a family with a home loan when the cash rate goes up. Show the RBA's 2–3% target.
- Play (15 to 25 minutes). Students play alone or in pairs. In pairs, both must agree and say a reason before they press Announce. Ask each student to write one line per meeting: the change, and the figure that decided it.
- Same news for everyone. Each game has a number, shown at the end. Add ?seed= and a number to the game's address, for example games/cash-rate/?seed=247, and the whole class gets the same news in the same quarters. Then you can compare decisions and scores.
- After (10 minutes). The end screen asks three questions: which shock was hardest, which channels one decision went through, and who gained and lost. Take a few answers from students who held the rate through the supply shock and from students who raised it.
- Extension. Year 10: write the board's 100-word statement for one meeting, quoting two indicators. Years 11 and 12: draw the oil shock and the China slowdown on an AD/AS diagram and explain why one is harder to deal with.
Accessibility
Works with a keyboard and a screen reader. Each new quarter and each decision is read out, and the charts have text descriptions. Large buttons on a phone. Motion is turned off if the device asks for reduced motion.